188 years Why did Australian department store David Jones fold after 188 years?
Australia's oldest department store entered voluntary administration with 38 physical stores and 6,000 staff operating nationwide.
At a glance
- David Jones entered voluntary administration on 5 November 2026.
- Scentre Group stated the retailer failed to pay October rent and breached its tenancy agreement.
- Next: Voluntary administrators McGrathNicol and receivers FTI Consulting are reviewing the company.
Drafted with AI from named sources and checked automatically; published by our AI editor after passing every check. How briefs are made
- BBC Business
- BBC Asia
The story
David Jones entered voluntary administration on 5 November 2026. The 188-year-old company is Australia's oldest department store.
The chain employs about 6,000 staff and operates 38 physical stores, including 17 in Westfield shopping centres. Scentre Group stated that the retailer had not paid its October rent, breaching its tenancy agreement.
Christopher Hill of FTI Consulting stated that rising costs, an outdated retail footprint, and supply chain challenges led to this point, adding that the process gives the business breathing space to restructure. CEO Erica Berthold thanked customers, team members, and partners for their continued support, noting that David Jones is an iconic company with many memories.
What each side says
Company Management
“David Jones is an iconic company and so many Australians have stories and memories of visiting DJ's stores.”Erica Berthold
Receivers
“We understand the current retail trading environment, rising costs, a significant and outdated retail footprint, and supply chain challenges have led to this point.”Christopher Hill
Who is involved
Scentre Group
Shopping centre company operating Westfield brand destinations in Australia and New ZealandIn this storyScentre Group said that David Jones had not paid its rent for October and was therefore in breach of its tenancy agreement3.
How we got here
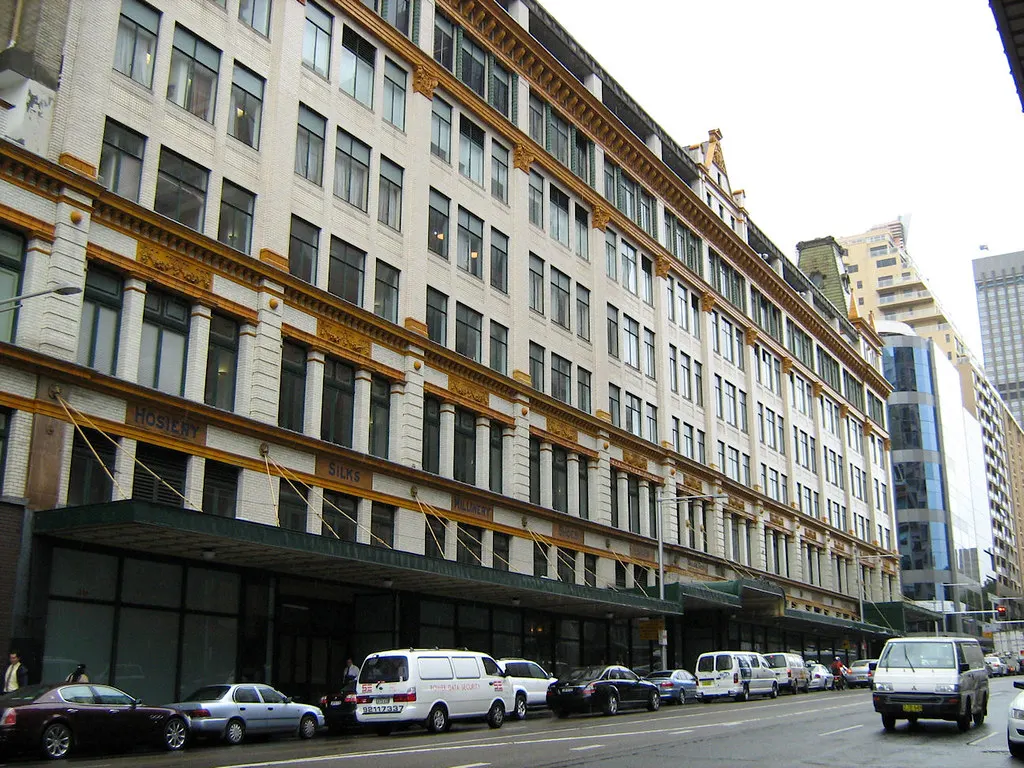
- 1954Queen Elizabeth II attended a banquet on the seventh floor of the Elizabeth Street store during her first visit to Sydney.
- 2026-11-05David Jones entered voluntary administration.
What the research says6 studies, 2008–2020
This literature review examines the academic and historical context surrounding retail industry developments and institutional retailing. Understanding these dynamics provides a foundation for examining the broader economic and structural factors affecting traditional department stores. The review is organised into historical foundations of the retail sector, the evolution of retail environments, and the impact of digital transformation on physical retail interfaces.
Historical Foundations and Retail Evolution
The retail industry comprises retail businesses that sell goods and services directly to end consumers, forming a fundamental pillar of modern commerce that influences consumption patterns, urban infrastructure, and labor markets according to Wikipedia's overview of the retail industry4. McArthur et al. (2015)5 noted that the evolution of retailing has interested academics across economics, history, geography, and marketing.
Because of its interdisciplinary appeal, the corpus of knowledge on retailing is composed of many disparate variables of analysis, ranging from transaction costs and entrepreneurs to environmental factors and the dispersion of stores (McArthur et al., 2015)5. Consequently, the literature that attempts to explain retailing evolution presents as a patchwork, and extant theories remain disconnected because of their narrowness of focus, leading researchers to apply a macro and systems theory approach to link together bodies of work (McArthur et al.
, 2015)5. Burt (2010)6 reviewed retail change in Europe over a twenty-year period, discussing the sociocultural context of retailing alongside macro level changes in the relative scale of Europe's largest retail organizations. Burt (2010)6 identified three underlying themes to retail change: the emergence of new markets in relation to geographical, product, service, and channel diversity; the evolution of the retailer as a brand encompassing product, store, and organizational dimensions; and the role of time as a competitive element through consumer and business behaviors and the pace of strategy.
Digital Transformation and Competitive Factors
In the modern business environment, staying competitive is a significant challenge for companies due to globalization and concentration, particularly within the fashion retail sector (Gonda et al., 2020)7. Gonda et al. (2020)7 mapped the situation of the sector focusing primarily on small and medium-sized enterprises through an extensive literature review to provide a better understanding of sector-specific competitive factors.
Simultaneously, Reinartz et al. (2018)8 examined how consumers have traditionally made purchase decisions at the store shelf, giving institutional brick-and-mortar retailers great power to learn about and influence behaviors and preferences. However, with the rise of e-commerce, mobile shopping, and smart technologies, new competitors threaten this long-standing supremacy (Reinartz et al., 2018)8. Adopting a value-creation perspective, Reinartz et al.
(2018)8 analyzed how digitization started the erosion of institutional retailing as the primary interface to the customer by developing a framework that identifies five new sources of value creation and proposing how these advance and transform competition for this interface.
Consumer Purchase Decisions and Market Environment
Research into retail markets has also focused on the specific determinants of consumer choices and business expansion strategies. Hanaysha (2018)9 examined the effects of corporate social responsibility, social media marketing, sales promotion, store environment, and perceived value on purchase decisions in the retail sector using a quantitative methodology with data collected from 278 retail store customers in Malaysia.
Hanaysha (2018)9 found that corporate social responsibility has significant positive effects on a purchase decision, whereas sales promotion has a negative effect on purchase decisions. In a different geographical and strategic context, Evans et al. (2008)10 considered whether the drivers of and impediments to retail internationalization and the business strategy adopted had changed, conducting interviews with 12 UK and US retailers combined with a literature review.
Evans et al. (2008)10 suggested that while a variety of factors drive retail internationalization, profit growth is the most dominant motivator.
The existing literature provides extensive analysis of retail evolution, digital transformation, and consumer decision-making across various international markets, yet it lacks specific empirical studies directly addressing the structural collapse and voluntary administration processes of long-standing national department store chains. While sources explore broad market trends such as retail industry transformations and corporate strategies, there is limited direct academic consensus on the specific tipping points that lead institutions with extensive physical footprints to enter administration. Furthermore, data tracking the immediate localized impacts on large workforces and multi-site physical store networks remains largely confined to corporate reports rather than peer-reviewed academic investigation.
Competitive Factors of Fashion Retail Sector with Special Focus on SMEs
Gyorgy Gonda et al. · EconomiesWhat to watch
- Voluntary administrators McGrathNicol and receivers FTI Consulting are reviewing the company.
- Physical and online stores will continue to operate while receivers review the business.
The data
Real GDP Growth Ranking
Australia: 2%, 140 of 195 countries (median 3.5%).
IMF World Economic OutlookDownload data (CSV, opens in Excel)
Show the numbers (195)
Indicator: real GDP growth · Year: 2025 · Source: IMF World Economic Outlook
| Rank | Country | Value |
|---|---|---|
| 1 | South Sudan | 41.4 |
| 2 | Guyana | 19.3 |
| 3 | Libya | 15.9 |
| 4 | Kyrgyzstan | 11.1 |
| 5 | Rwanda | 9.4 |
| 6 | Ethiopia | 9.2 |
| 7 | Venezuela | 9 |
| 8 | Taiwan Province of China | 8.8 |
| 9 | Tajikistan | 8.4 |
| 10 | Zimbabwe | 8.3 |
| 11 | Bhutan | 8.2 |
| 12 | Benin | 8.1 |
| 13 | Ireland | 8 |
| 14 | Vietnam | 8 |
| 15 | India | 7.8 |
| 16 | Uzbekistan | 7.7 |
| 17 | Georgia | 7.5 |
| 18 | Armenia | 7.1 |
| 19 | Guinea | 6.9 |
| 20 | Niger | 6.9 |
| 21 | Mongolia | 6.8 |
| 22 | Senegal | 6.7 |
| 23 | Uganda | 6.7 |
| 24 | Paraguay | 6.6 |
| 25 | Côte d'Ivoire | 6.5 |
| 26 | Kazakhstan | 6.5 |
| 27 | Aruba | 6.3 |
| 28 | Cabo Verde | 6.3 |
| 29 | Maldives | 6.3 |
| 30 | Togo | 6.3 |
| 31 | Papua New Guinea | 6.2 |
| 32 | United Arab Emirates | 6.2 |
| 33 | Ghana | 6 |
| 34 | Palau | 6 |
| 35 | Tanzania | 5.9 |
| 36 | Central African Republic | 5.8 |
| 37 | Guinea-Bissau | 5.8 |
| 38 | Seychelles | 5.8 |
| 39 | Democratic Republic of the Congo | 5.7 |
| 40 | The Gambia | 5.7 |
| 41 | Burkina Faso | 5.3 |
| 42 | Cambodia | 5.3 |
| 43 | Malaysia | 5.2 |
| 44 | Tuvalu | 5.2 |
| 45 | Chad | 5.1 |
| 46 | Indonesia | 5.1 |
| 47 | Liberia | 5.1 |
| 48 | China | 5 |
| 49 | Singapore | 5 |
| 50 | Sri Lanka | 5 |
| 51 | Djibouti | 4.9 |
| 52 | Eswatini | 4.9 |
| 53 | Mali | 4.9 |
| 54 | Morocco | 4.9 |
| 55 | Nicaragua | 4.9 |
| 56 | Grenada | 4.8 |
| 57 | Laos | 4.8 |
| 58 | Sierra Leone | 4.8 |
| 59 | Macao SAR | 4.7 |
| 60 | Malta | 4.7 |
… 135 more rows in the CSV
Inflation Ranking
Australia: 2.8%, 101 of 195 countries (median 3%).
IMF World Economic OutlookDownload data (CSV, opens in Excel)
Show the numbers (195)
Indicator: inflation · Year: 2025 · Source: IMF World Economic Outlook
| Rank | Country | Value |
|---|---|---|
| 1 | Venezuela | 252 |
| 2 | Sudan | 99.9 |
| 3 | South Sudan | 97.6 |
| 4 | Zimbabwe | 81.4 |
| 5 | Iran | 50.6 |
| 6 | Argentina | 41.9 |
| 7 | Türkiye | 34.9 |
| 8 | Burundi | 34 |
| 9 | Malawi | 28.4 |
| 10 | Haiti | 28.3 |
| 11 | Nigeria | 23 |
| 12 | Myanmar | 21.1 |
| 13 | Egypt | 20.4 |
| 14 | Angola | 20.2 |
| 15 | Yemen | 20.2 |
| 16 | Bolivia | 19.5 |
| 17 | Ethiopia | 16 |
| 18 | Lebanon | 14.6 |
| 19 | Ghana | 14.2 |
| 20 | Zambia | 13.9 |
| 21 | Ukraine | 12.7 |
| 22 | Kazakhstan | 11.4 |
| 23 | West Bank and Gaza | 10.5 |
| 24 | Bangladesh | 10 |
| 25 | Suriname | 9.2 |
| 26 | Uzbekistan | 8.8 |
| 27 | Russia | 8.7 |
| 28 | Mongolia | 8.6 |
| 29 | Liberia | 8.3 |
| 30 | Kyrgyzstan | 8.2 |
| 31 | Madagascar | 8 |
| 32 | The Gambia | 7.9 |
| 33 | Moldova | 7.8 |
| 34 | Laos | 7.7 |
| 35 | Sierra Leone | 7.6 |
| 36 | Democratic Republic of the Congo | 7.4 |
| 37 | Romania | 7.3 |
| 38 | Rwanda | 7 |
| 39 | Belarus | 6.6 |
| 40 | Naoero | 6.1 |
| 41 | Kiribati | 5.9 |
| 42 | Azerbaijan | 5.6 |
| 43 | Tunisia | 5.3 |
| 44 | Colombia | 5.1 |
| 45 | Brazil | 5 |
| 46 | Estonia | 4.8 |
| 47 | Uruguay | 4.7 |
| 48 | Honduras | 4.6 |
| 49 | Pakistan | 4.5 |
| 50 | Croatia | 4.4 |
| 51 | Hungary | 4.4 |
| 52 | Mozambique | 4.4 |
| 53 | Papua New Guinea | 4.4 |
| 54 | Chile | 4.2 |
| 55 | Slovakia | 4.2 |
| 56 | Iceland | 4.1 |
| 57 | Kenya | 4.1 |
| 58 | Marshall Islands | 4.1 |
| 59 | Nepal | 4.1 |
| 60 | North Macedonia | 4.1 |
… 135 more rows in the CSV
Unemployment Rate
Australia: 4.2% in 2025 (+0.2 pts from 2024).
dashed = IMF forecastIMF World Economic OutlookDownload data (CSV, opens in Excel)
Show the numbers (31)
Country: Australia · Indicator: unemployment rate · Source: IMF World Economic Outlook
| Year | Value | Forecast |
|---|---|---|
| 2001 | 6.8 | no |
| 2002 | 6.4 | no |
| 2003 | 5.9 | no |
| 2004 | 5.4 | no |
| 2005 | 5 | no |
| 2006 | 4.8 | no |
| 2007 | 4.4 | no |
| 2008 | 4.3 | no |
| 2009 | 5.6 | no |
| 2010 | 5.2 | no |
| 2011 | 5.1 | no |
| 2012 | 5.2 | no |
| 2013 | 5.7 | no |
| 2014 | 6.1 | no |
| 2015 | 6.1 | no |
| 2016 | 5.7 | no |
| 2017 | 5.6 | no |
| 2018 | 5.3 | no |
| 2019 | 5.2 | no |
| 2020 | 6.5 | no |
| 2021 | 5.1 | no |
| 2022 | 3.7 | no |
| 2023 | 3.7 | no |
| 2024 | 4 | no |
| 2025 | 4.2 | no |
| 2026 | 4.4 | yes |
| 2027 | 4.7 | yes |
| 2028 | 4.8 | yes |
| 2029 | 4.6 | yes |
| 2030 | 4.6 | yes |
| 2031 | 4.6 | yes |
IMF World Economic Outlook (IMF data, reused with citation)
Background
At a glance
 Australia
- Capital
- Canberra
- Population
- 27.7 million
- Leaders
- Charles III · Anthony Albanese
- Currency
- Australian dollar
Wikidata · IMF, 2026-11-07
Sources and method
References (13)
News reports
Studies
- Ellen McArthur et al. (2015). The Evolution of Retailing Journal of Macromarketing
- Steve L. Burt (2010). Retailing in Europe: 20 years on The International Review of Retail Distribution and Consumer Research
- Gyorgy Gonda et al. (2020). Competitive Factors of Fashion Retail Sector with Special Focus on SMEs Economies
- Werner Reinartz et al. (2018). The Impact of Digital Transformation on the Retailing Value Chain International Journal of Research in Marketing
- Jalal Rajeh Hanaysha (2018). An examination of the factors affecting consumer’s purchase decision in the Malaysian retail market PSU Research Review
- Jody Evans et al. (2008). Revisiting retail internationalisation International Journal of Retail & Distribution Management
Background
- Scentre Group Wikipedia
- Scentre Group (Wikidata) Wikidata
- Retail industry Wikipedia
Reports used for this brief
- Australia's oldest department store David Jones folds after 188 years BBC Business
- Australia's oldest department store David Jones folds after 188 years BBC Asia
Data
- IMF World Economic Outlook IMF data, reused with citation
How this brief was made
Automated research by ZynoNews: trending topic detected across news, searches and Wikipedia; facts and statements from the reports listed; numbers computed from open data; checked automatically for numbers, sources, copying and neutrality. Version 1. 2 news reports from 2 outlets, 3 official datasets, 6 research studies and 3 background sources.
Cite this
For papers, reports and theses. ZynoNews articles keep their address; updates are listed with their date.
ZynoNews Desk. (2026, November 7). Why did Australian department store David Jones fold after 188 years?. ZynoNews. https://zynonews.org/news/why-did-australian-department-store-david-jones-fold-after-188-years-db6cf3