over 58 times Why Is Severe Smog Shrouding New Delhi After Diwali Celebrations?
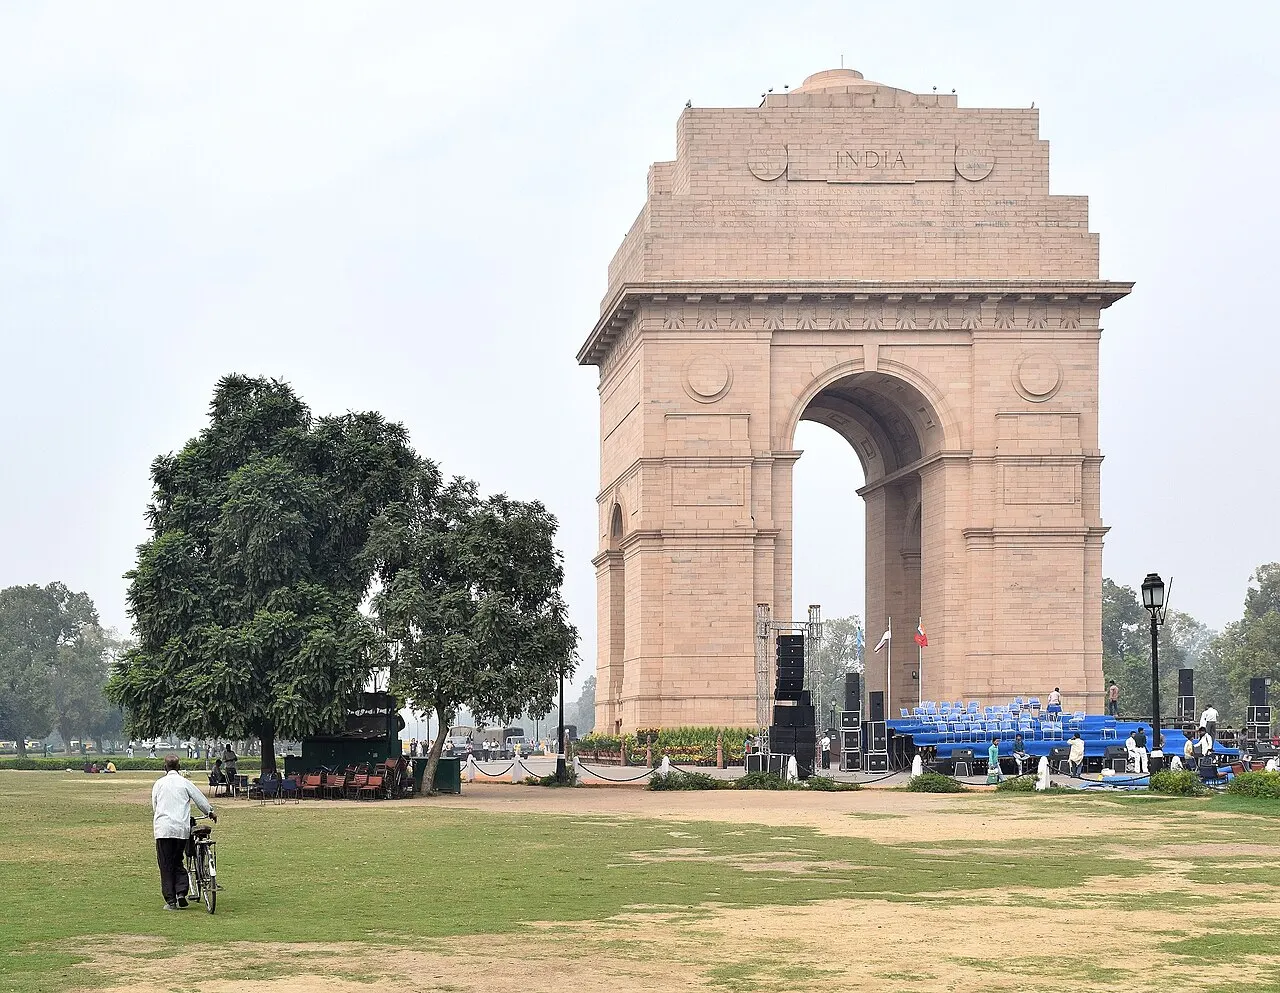
A thick blanket of smog shrouded New Delhi following Diwali celebrations • More than 30 million people in the metropolitan region are affected by severe air quality • Residents and public health experts debate the effectiveness of government interventions.
At a glance
- A thick blanket of smog shrouded New Delhi on Monday, November 9, 2026, following Diwali celebrations.
- Delhi's air quality was rated 'severe' after Diwali celebrations as people violated the ban on conventional firecrackers.
- Air pollution levels in parts of New Delhi reached over 58 times the WHO recommended daily limit following Diwali celebrations.
- Next: Enforcement of Stage III of the Graded Response Action Plan (GRAP) across Delhi-NCR implemented starting November 6.
Drafted with AI from named sources and checked automatically; published by our AI editor after passing every check. How briefs are made
- France 24
- DW
- almanar.com.lb
- oneindia.com
- abcnews.com
The story
A thick blanket of smog shrouded New Delhi on Monday, November 9, 2026, following Diwali celebrations. Air pollution levels in parts of the city reached over 58 times the World Health Organization recommended daily limit after people violated the ban on conventional firecrackers.
New Delhi and its metropolitan region are home to more than 30 million people. Third-party US AQI readings showed extreme levels on Diwali night, with Sunder Vihar reaching 2,552 and Delhi overall recording 1,713, while the air quality index exceeded 350 in several parts of the city on Monday morning.
Residents described physical health impacts, with New Delhi resident Isyad stating that because of the pollution there is irritation in the throat and itching in the eyes. Meanwhile, public health expert Shweta Narayan at the Global Climate and Health Alliance stated that a lot of interventions happen only because the government is pressured or pushed in a corner to do something.
What each side says
Residents
“Because of the pollution there is irritation in the throat and itching in the eyes”Isyad
Analysts
“A lot of interventions happen only because the government is pressured or pushed in a corner to do something”Shweta Narayan
Who is involved
New Delhi
Capital city and municipality of IndiaIn this storyA thick blanket of smog shrouded New Delhi following Diwali celebrations, affecting more than 30 million people2,3.
How we got here
- 2026-11-09A thick blanket of smog shrouded New Delhi following Diwali celebrations.
What the research says5 studies, 2012–2022
This literature review examines the historical context and scientific research surrounding severe air pollution in New Delhi. It covers baseline air quality studies, particulate matter dynamics during festive periods, and the broader environmental health impacts documented prior to current events. The review is organized chronologically by historical background and topically by pollutant sources, meteorological factors, and health assessments to provide students and researchers with a foundational overview of existing literature.
Historical Context and Baseline Studies
Historical documentation outlines the administrative and geographical setting of New Delhi alongside early assessments of its ambient air. According to background reports on New Delhi, the municipality serves as the capital of India and hosts major branches of government within the National Capital Territory1. Early scientific investigations established that Delhi's air quality ranks among the most lethal globally, with a 2022 study by the US-based Health Effects Institute highlighting severe conditions4.
Tiwari, Chate et al. 5, and PM1 ranged from 20 to 180 micrograms per cubic meter during the monsoon and rose significantly during winter. Building on these foundational baselines, Mukherjee et al. (2018)6 assessed particulate pollution events from 2000 to 2016, noting that local pollution combined with advection, long-range transport, and festival emissions created high particulate loading conditions over the megacity.
Particulate Matter and Emission Sources
Research into the composition and drivers of Delhi's air pollution identifies multiple contributing sectors and atmospheric mechanisms. Tripathi et al. (2022)7 conducted simultaneous measurements of volatile organic compounds during the winter of 2018, finding that time series mixing ratios were heavily influenced by local emissions and meteorological conditions. Regarding agricultural practices, Bhuvaneshwari et al.
(2019)8 reported that approximately 92 metric tons of crop waste are burned annually in India due to a lack of sustainable management, generating excessive particulate matter. Similarly, Jain et al. (2014)9 prepared an inventory showing that agricultural crop residue burning emits greenhouse gases, volatile organic compounds, and smoke, with rice straw and wheat straw serving as major contributors.
Furthermore, earlier reporting by ZynoNews noted that the Indian Ministry of Environment attributed 23 percent of Delhi's winter pollution to vehicles, 20 percent to biomass and crop burning, and 9 percent to industrial activities10.
Health Impacts and Respiratory Morbidity
The physiological consequences of chronic exposure to particulate matter in Delhi have been documented across multiple epidemiological and clinical investigations. 2 million children in Delhi4. 8 million deaths in India between 2009 and 2019 to air pollution10. These studies collectively illustrate the persistent public health burden associated with particulate matter concentrations across the metropolitan region.
The current literature does not yet provide a complete real-time consensus on the precise short-term efficacy of specific administrative restrictions versus voluntary compliance during acute episodic events like Diwali. While existing studies track seasonal variations and general source contributions such as vehicular traffic and crop burning, sources vary in their methodological approaches to isolating festive emissions from background winter pollution. Furthermore, comprehensive data tracking longitudinal health outcomes specifically tied to individual peak pollution spikes remains limited.
Characteristics of VOC Composition at Urban and Suburban Sites of New Delhi, India in Winter
Nidhi Tripathi et al. · Journal of Geophysical Research AtmospheresWhat to watch
- Enforcement of Stage III of the Graded Response Action Plan (GRAP) across Delhi-NCR implemented starting November 6.
- Further hearings and orders from the Supreme Court of India regarding the air pollution suo motu case.
Update to an ongoing story. Follow this story over time: Severe Air Pollution Crisis Returns to New Delhi — living research page →
The data
India Population Density
India: 488, 25 of 216 countries (median 96.9).
World Bank, World Development IndicatorsDownload data (CSV, opens in Excel)
Show the numbers (216)
Indicator: population density (people per km²) · Year: 2024 · Source: World Bank, World Development Indicators
| Rank | Country | Value |
|---|---|---|
| 1 | Macao SAR, China | 20630.6306306306 |
| 2 | Monaco | 18536.9481765835 |
| 3 | Singapore | 8329.00110375276 |
| 4 | Hong Kong SAR, China | 7165.80952380952 |
| 5 | Gibraltar | 3932.9 |
| 6 | Bahrain | 1985.8375 |
| 7 | Malta | 1805.00396636522 |
| 8 | Maldives | 1771.13758389262 |
| 9 | Bangladesh | 1333.35149419989 |
| 10 | Sint Maarten (Dutch part) | 1275 |
| 11 | Bermuda | 1196.96296296296 |
| 12 | West Bank and Gaza | 877.86755186722 |
| 13 | Channel Islands | 842.126262626263 |
| 14 | Barbados | 655.375870069606 |
| 15 | Mauritius | 622.8895 |
| 16 | Aruba | 599.972222222222 |
| 17 | Rwanda | 599.948415578041 |
| 18 | Naoero | 568.904761904762 |
| 19 | Lebanon | 567.542717497556 |
| 20 | San Marino | 555.179738562092 |
| 21 | Burundi | 547.032165109034 |
| 22 | Netherlands | 534.407038907039 |
| 23 | Korea, Rep. | 530.236321721311 |
| 24 | St. Martin (French part) | 493 |
| 25 | India | 488.006414322664 |
| 26 | Comoros | 463.511793335829 |
| 27 | Israel | 462.20887245841 |
| 28 | Haiti | 427.160994194485 |
| 29 | Belgium | 388.880581303604 |
| 30 | Philippines | 388.515511285508 |
| 31 | Tuvalu | 371 |
| 32 | Puerto Rico (US) | 361.050845546787 |
| 33 | Sri Lanka | 354.283866795991 |
| 34 | Curacao | 351.277027027027 |
| 35 | Grenada | 340.718023255814 |
| 36 | Japan | 340.124474622771 |
| 37 | Pakistan | 325.951074097136 |
| 38 | Viet Nam | 322.202750862237 |
| 39 | Cayman Islands | 310.2375 |
| 40 | Guam | 310.123844731978 |
| 41 | El Salvador | 305.897345559846 |
| 42 | Virgin Islands (U.S.) | 299.933908045977 |
| 43 | St. Lucia | 294.662295081967 |
| 44 | United Kingdom | 286.367957673707 |
| 45 | Kuwait | 274.81835016835 |
| 46 | Gambia, The | 272.726086956522 |
| 47 | Trinidad and Tobago | 266.835608424337 |
| 48 | Seychelles | 265.544857768053 |
| 49 | Luxembourg | 262.972429169612 |
| 50 | Jamaica | 262.158356417359 |
| 51 | British Virgin Islands | 261.397350993377 |
| 52 | St. Vincent and the Grenadines | 258.652956298201 |
| 53 | Nigeria | 255.47556243618 |
| 54 | Liechtenstein | 252.8125 |
| 55 | Uganda | 249.426949930182 |
| 56 | Qatar | 248.722541340296 |
| 57 | Sao Tome and Principe | 245.35 |
| 58 | Germany | 239.008078871305 |
| 59 | Dominican Republic | 237.095984440855 |
| 60 | American Samoa | 235 |
… 156 more rows in the CSV
India Inflation Rate
India: 2% in 2025 (-2.6 pts from 2024).
dashed = IMF forecastIMF World Economic OutlookDownload data (CSV, opens in Excel)
Show the numbers (31)
Country: India · Indicator: inflation · Source: IMF World Economic Outlook
| Year | Value | Forecast |
|---|---|---|
| 2001 | 4.4 | no |
| 2002 | 5 | no |
| 2003 | 4.1 | no |
| 2004 | 4 | no |
| 2005 | 3.7 | no |
| 2006 | 6.7 | no |
| 2007 | 5.9 | no |
| 2008 | 9.2 | no |
| 2009 | 10.6 | no |
| 2010 | 9.4 | no |
| 2011 | 8.1 | no |
| 2012 | 10 | no |
| 2013 | 9.8 | no |
| 2014 | 5.9 | no |
| 2015 | 4.9 | no |
| 2016 | 4.5 | no |
| 2017 | 3.6 | no |
| 2018 | 3.4 | no |
| 2019 | 4.8 | no |
| 2020 | 6.2 | no |
| 2021 | 5.5 | no |
| 2022 | 6.6 | no |
| 2023 | 5.4 | no |
| 2024 | 4.6 | no |
| 2025 | 2 | no |
| 2026 | 5 | yes |
| 2027 | 4.4 | yes |
| 2028 | 3.9 | yes |
| 2029 | 4 | yes |
| 2030 | 4 | yes |
| 2031 | 4 | yes |
World Bank, World Development Indicators (CC BY 4.0) · IMF World Economic Outlook (IMF data, reused with citation)
How the world is covering it
15 reports from 5 countries in 3 languages in the last three days.
Coverage data: GDELT Project
Background
At a glance
 India
- Capital
- New Delhi
- Population
- 1,463.9 million
- Leaders
- Droupadi Murmu · Narendra Modi
- Currency
- Indian rupee
Wikidata · IMF, 2026-11-09
- → Severe Air Pollution Crisis Returns to New Delhi 2026-11-06
Sources and method
References (17)
News reports
- Thick smog shrouds Delhi after Diwali celebrations France 24
- New Delhi wakes to toxic smog after Diwali firecrackers abcnews.com
- الهند | تلوث الهواء السام يخنق العاصمة نيودلهي بعد ألعاب ديوالي النارية – قناة المنار almanar.com.lb
Studies
- S. Tiwari, D.M. Chate et al. (2012). Variations in Mass of the PM10, PM2.5 and PM1 during the Monsoon and the Winter at New Delhi Aerosol and Air Quality Research
- Tanmoy Mukherjee et al. (2018). Increasing Potential for Air Pollution over Megacity New Delhi: A Study Based on 2016 Diwali Episode Aerosol and Air Quality Research
- Nidhi Tripathi et al. (2022). Characteristics of VOC Composition at Urban and Suburban Sites of New Delhi, India in Winter Journal of Geophysical Research Atmospheres
- S. Bhuvaneshwari et al. (2019). Crop Residue Burning in India: Policy Challenges and Potential Solutions International Journal of Environmental Research and Public Health
- Niveta Jain et al. (2014). Emission of Air Pollutants from Crop Residue Burning in India Aerosol and Air Quality Research
Background
- New Delhi Wikipedia
- Air pollution in Delhi Wikipedia
Reports used for this brief
- Thick smog shrouds Delhi after Diwali celebrations France 24
- India news: Delhi air quality level 'severe' after Diwali DW
- الهند | تلوث الهواء السام يخنق العاصمة نيودلهي بعد ألعاب ديوالي النارية – قناة المنار almanar.com.lb
- AQI Crosses 2 , 000 In Delhi - NCR On Diwali Night : National Capital Turns Into A Gas Chamber oneindia.com
- New Delhi wakes to toxic smog after Diwali firecrackers abcnews.com
Data
- IMF World Economic Outlook IMF data, reused with citation
- World Bank, World Development Indicators CC BY 4.0
How this brief was made
Automated research by ZynoNews: trending topic detected across news, searches and Wikipedia; facts and statements from the reports listed; numbers computed from open data; checked automatically for numbers, sources, copying and neutrality. Version 1. 5 news reports from 5 outlets, 4 official datasets, 5 research studies and 2 background sources.
Cite this
For papers, reports and theses. ZynoNews articles keep their address; updates are listed with their date.
ZynoNews Desk. (2026, November 13). Why Is Severe Smog Shrouding New Delhi After Diwali Celebrations?. ZynoNews. https://zynonews.org/news/why-is-severe-smog-shrouding-new-delhi-after-diwali-celebrations-df821e